You look at a paper map and get coordinates: 46° 23.35′ north latitude and 006° 23.4′ west longitude. Another problem asks you to measure 7.4 miles along a bearing of 232° from the Point Victoria light. It seems like just a ruler would do the trick, but the slightest error of a fraction of a minute, a misalignment of the symbol center, or an incorrect turn of the plotter will send the point to the wrong part of the area.
Working with a nautical chart typically boils down to two scenarios. A position is plotted using the intersection of latitude and longitude, or constructed from a known object using direction and distance. To achieve accurate results, all you need is an up-to-date chart, basic tools, and the ability to verify that the resulting point complies with common sense.
How to get started with a nautical chart
Nautical charts use a coordinate grid, which specifies the position of a point on the Earth's surface. Latitude is measured from the equator: from 0° to 90° north or south. Longitude is measured from the Greenwich, or prime, meridian: from 0° to 180° east or west.
New Orleans's position is given as 30° north latitude and 90° west longitude. If the first coordinate is placed north of the equator and the second west of Greenwich, the lines will converge at the desired point. The same principle applies to degrees, minutes, and fractions of a minute on the side and top scales of the sheet.
Before plotting, check the publication number, print date, and update date against the Notices to Mariners. The sheet's coordinate system must match your GPS settings. The example uses Map 3 at a scale of 1:100,000 and the detailed Map 4. The latter contains fictitious sections and is not intended for real-world navigation.
What publications and markings are needed before entering the area?
A piece of paper alone doesn't replace reference books, which help decipher markings and prepare for port entry. A ship's log records time, distance traveled, speed, compass heading, coordinates, crew composition, and onboard activities.
- Symbols and Abbreviations Directory 5011 Deciphers nautical chart symbols and complex abbreviations.
- Almanac Contains information on ports, lights, signals, marinas and available services in a particular area.
- Pilot chart It warns of dangers and shows harbor entrances in photographs. It is studied before approaching the port.
- Tide tables give water heights at route points.
- Atlas of tidal currents shows the speed and direction of the currents.
Unknown signs are checked against the 5011 reference book or the almanac pages. Before setting out, make sure the selected sailing directions, tables, and reference books cover your specific navigation area.
How to read depths, map zero, colors, and dangers
Depths on the map in question are indicated in meters and are scaled to map datum—a very low water level, close to the lowest astronomical tide. In the tutorial calculation, the actual depth is calculated using the mark on the sheet plus the high tide. For example, the circled number 27 means 27 m, the numbers 3 and 6 mean 3.6 m, and 6 and 1 mean 6.1 m.
The depth mark on a nautical chart distinguishes between permanent water and drying zones. The underlined number indicates the height of the ground above the chart's datum. The mark -0.2 m indicates an area that protrudes 0.2 m above the water at datum. If the tide is 0.2 m, the ground will barely disappear, while at 1.2 m, the depth above it will reach a meter. This example is for a specific educational situation and does not replace hydrometeorological calculations.
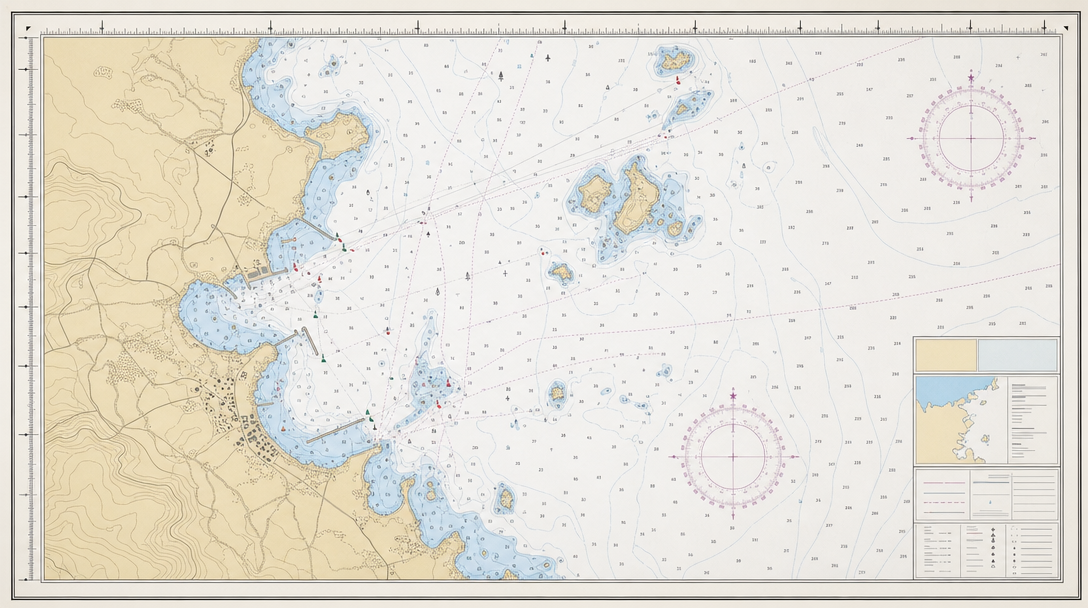
Colors mirror the numerical data. Yellow always represents land, white and blue represent water. The green area alternates between the shore and the seabed, depending on the tide. As the depth increases, the blue shade lightens and turns to white.
Heights and vertical dimensions are referenced to their respective levels. The height of the lighthouse in the example is 6 meters above the mean high water mark at spring tide. The clearance under the bridge of 2.6 meters is measured from the highest astronomical tide. In addition to depths, the chart also indicates rocks, sunken objects, anchorages, fairways, pipelines, whirlpools, and traffic separation schemes. The values are verified against the reference book: a cross with four dots warns of an object just below the surface, and an anchor indicates a permitted anchorage.
How to determine coordinates on a nautical chart
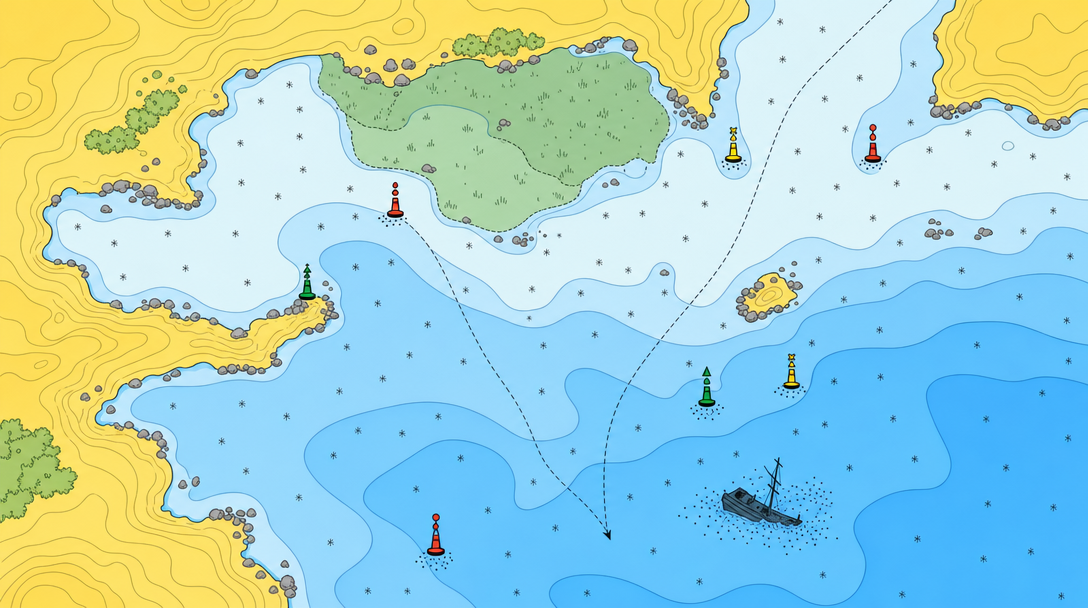
To plot the route, you'll need a plotter, measuring instruments, and a sharp pencil. The side scale on the sheet shows latitude, and the top scale shows longitude. The assignment asks you to find the symbol at 46° 23.35' N, 006° 23.4' W. The latitude is north of 46°, and the longitude is west of 6°.
Applying latitude
- On the side scale, find 46° and count 23 minutes.
- Add 0.35 minutes: the desired mark will be between 23.3 and 23.4.
- Make a short pencil mark. Place the scriber at a 90° angle to the side edge and draw a line.
- Assess the position of the tool strictly from above to ensure perpendicularity.
Applying longitude and checking the point
- On the top scale, find 6° West longitude and count 23.4 minutes.
- Draw a line down from the mark. The intersection with the latitude will give the desired position.
- Make sure the coordinates are in the correct hemispheres and the lines are perpendicular to the edges.
In this example, the intersection of the lines points to the "4 Juliet Delta" drilling platform in the upper left corner. The sequence explains how to determine coordinates on a nautical chart, but accuracy depends on the sharpness of your pencil and the care with which you plot.
How to plot a position using bearing and distance
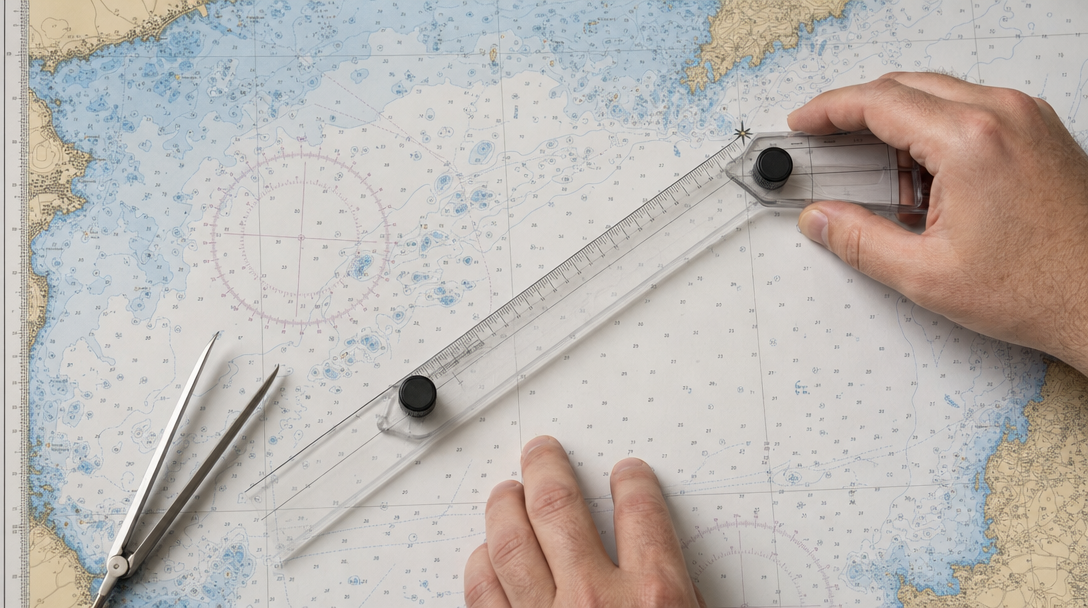
The second task starts from a known landmark. The goal is to find an object 7.4 miles away along a bearing of 232° from the Point Victoria light. The light's true position is precisely in the center of the drawn star, not on its edge. Before plotting the plotter, it's worth mentally estimating the azimuth: 232° points southwest, and the future line should go exactly there.
Construction of a given bearing
- Align the edge of the plotter's ruler with the center of the Point Victoria fire star.
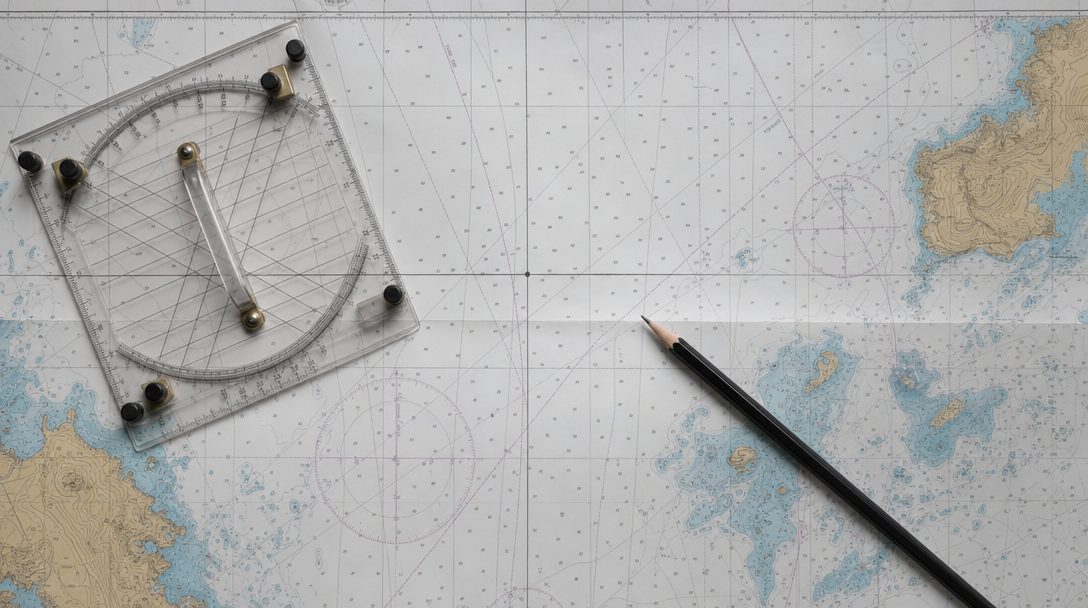
- Set the rotating disk to 232°. The large arrow indicates the bearing direction, and the small arrow points to the northern edge of the sheet.
- Rotate the instrument until the disc's grid is parallel to the vertical or horizontal lines of the map. It's easiest to hold the disc over a clear area of water.
- Draw a line from the center of the fire in the given direction.
- Use your measuring tools to measure 7.4 miles from your starting point.
Distance is measured exclusively by the lateral latitude scale, where one minute equals one nautical mile. On Map 3, each small division corresponds to 0.2 miles. Simply open the legs of the compass to seven full miles and add two divisions for 0.4 miles.
Taking bearings and distances between points
- Place the edge of the plotter at the center of the fire and the oil platform. A thin pencil line between them will make the work easier.
- Point the large arrow from the fire toward the platform. Orient the central disk so the north arrows are facing up and align its grid with the map lines.
- Calculate the angle. In the example, it's 232° true bearing, since the directions on the sheet are relative to true north.
- Place the feet of the measuring instruments at the centers of the markings, transfer this solution to the latitude scale and record a distance of 7.4 miles.
When figuring out how to determine a bearing on a nautical chart, the most important thing is to monitor the actual direction. If the pencil points northeast instead of southwest, the plotter is flipped 180°. A rough visual estimate of the azimuth should always precede a precise instrumental plot.
What to check before completing the installation
Paper-based marine navigation requires methodical work, from preparing the sheet to the final verification of coordinates against visual information. Only after a brief check can the vessel be entrusted with the obtained waypoint.
- Does the sheet's coordinate system match the GPS settings and have the latest Notices to Mariners been taken into account?
- Is the difference between depth, drainage height and bridge clearance relative to chart datum and tide levels clear?
- Are the lines drawn strictly from the center of the navigation symbol and are they perpendicular to the edges of the sheet?
- Is the plotter's main arrow pointing in the direction of travel, and is the distance measured solely on the side latitude scale?